

Know Your Market · Part 2 of 2
How to Estimate Local Market Size With Free Census Data
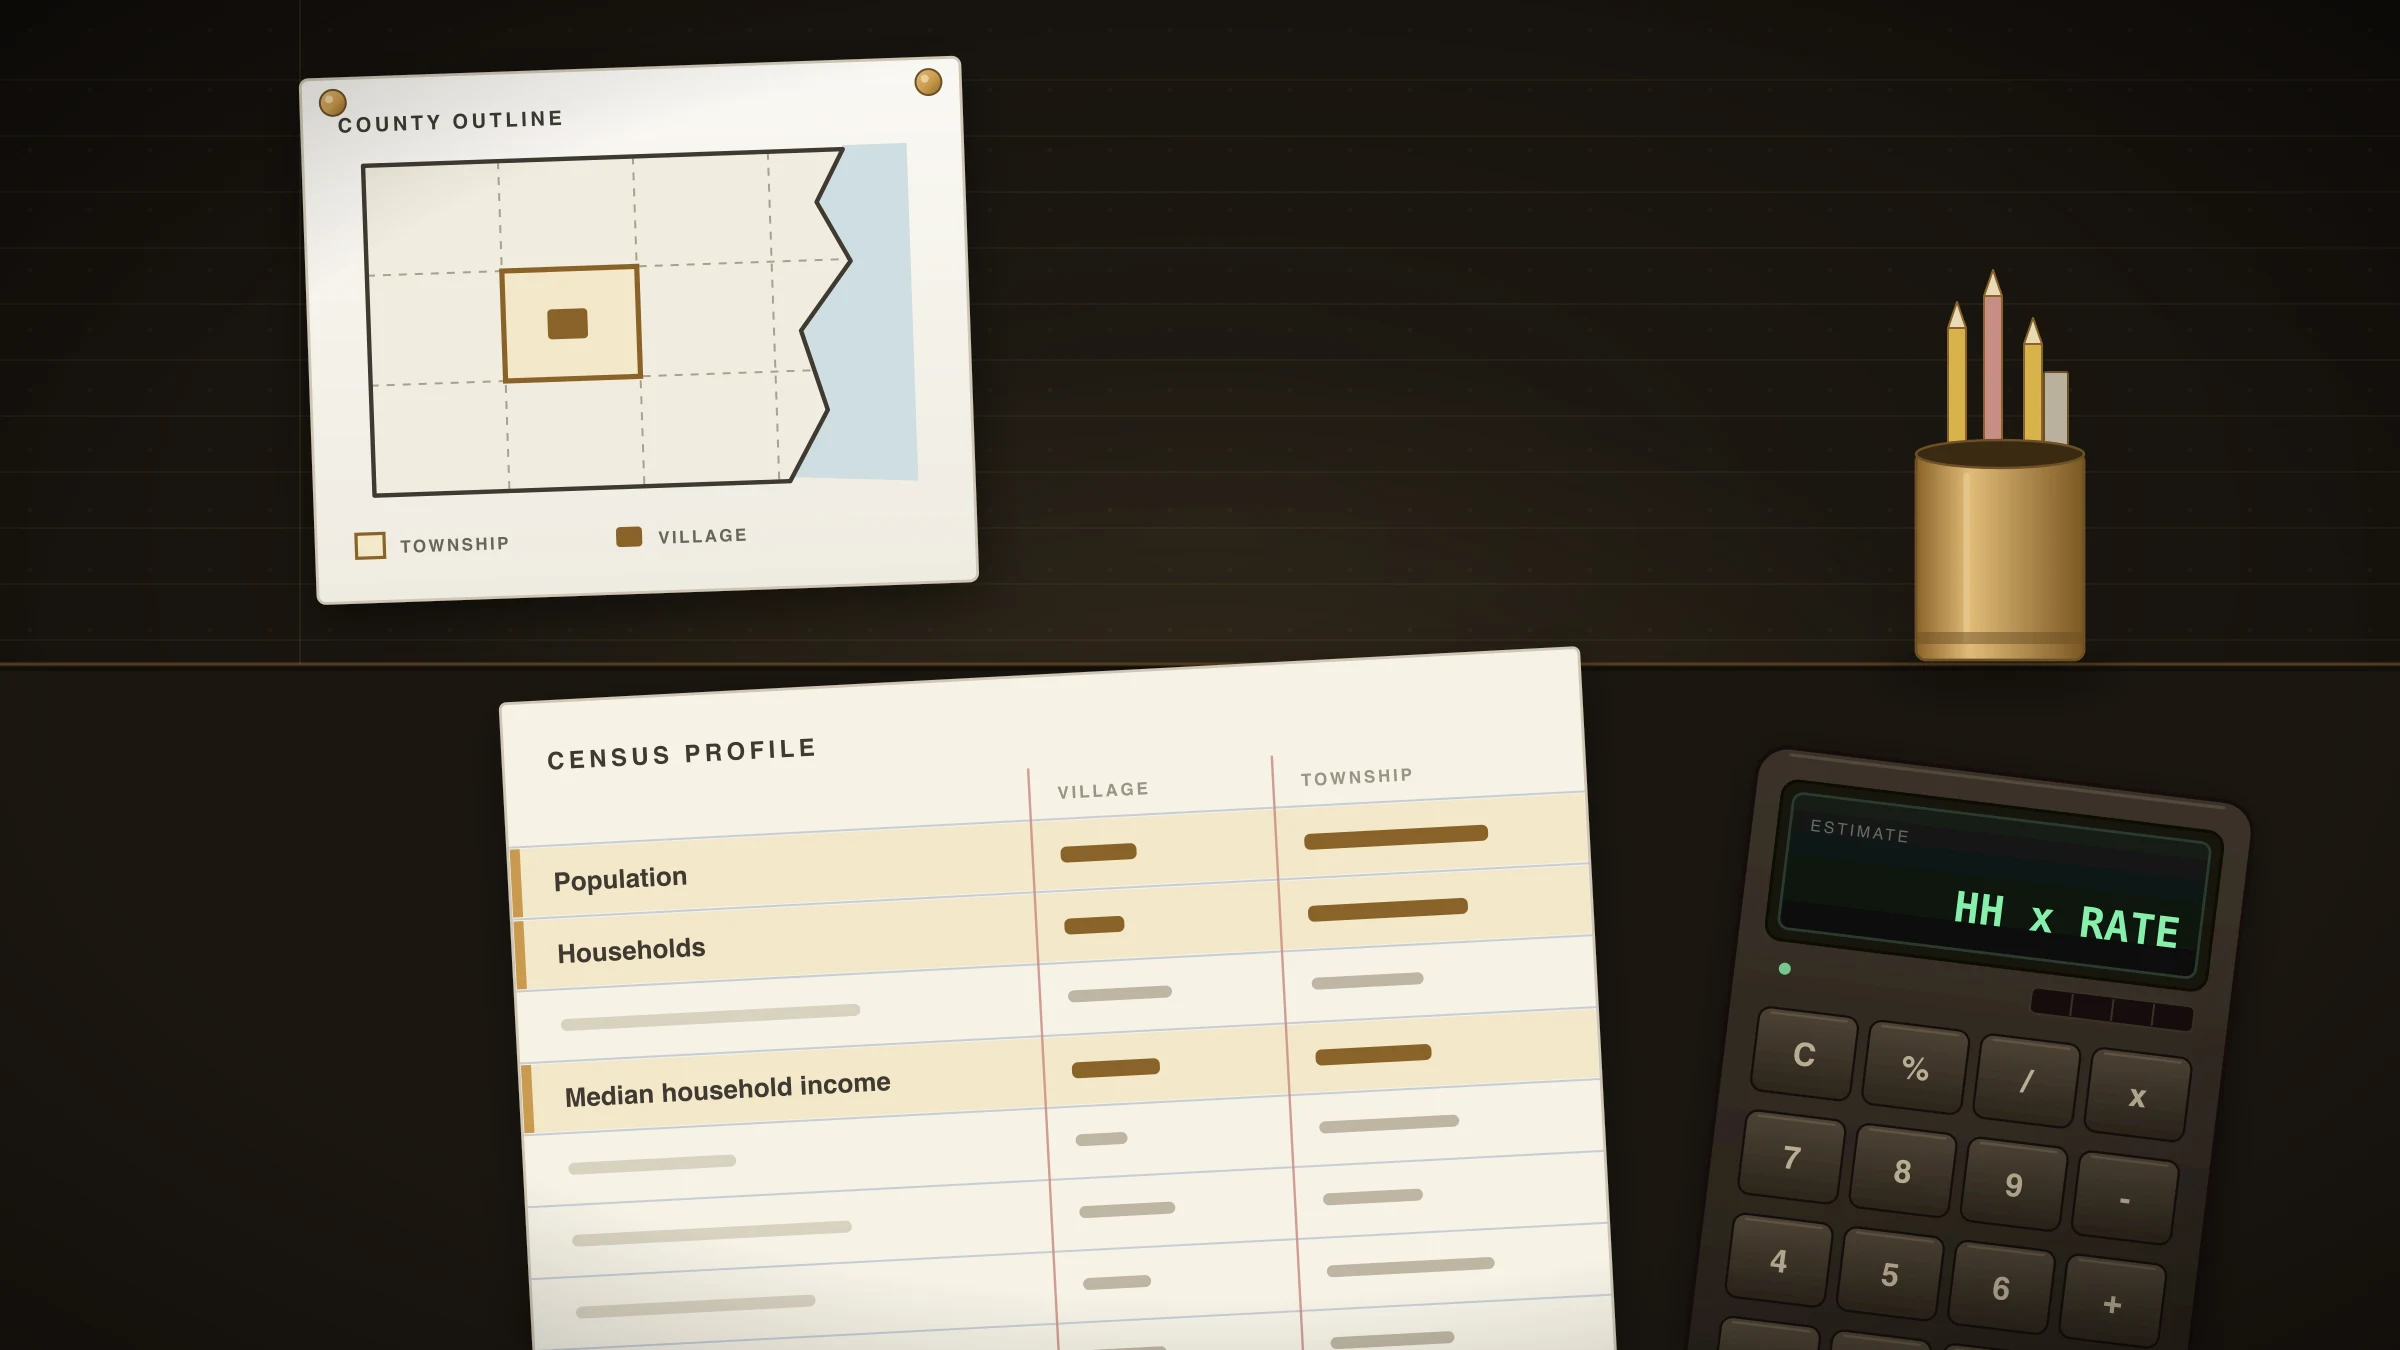
"Is there enough business around here?" Every owner asks it before a new service, a new truck or a new lease, and most answer it by feel.
You can do better than feel in about an hour. This post shows how to estimate local market size from free Census figures: how many households near you could buy, how many probably will this year, and what that is worth. The answer will be a range, not a number, and every assumption stays visible so you can argue with it.
It is the first sum we do in our market research work, and it is one technique from the wider afternoon method in How to Do Market Research Yourself.
Step 1: Pick the geography your customers actually come from
The commonest mistake happens before any arithmetic: looking up the wrong place.
We are based in Clarkston. The incorporated place with that name is a small downtown sitting inside Independence Township, and most of the people who shop, eat and hire here live in the township around it. Look up the downtown alone and you badly undercount.
The Census Bureau's 2024 ACS 5-year estimates put Independence Township at 36,982 residents in 13,960 households, with a median household income of $114,699. A short drive north, the village of Ortonville sits inside Brandon Township: 15,440 residents, 6,143 households, median household income $93,523.
Two neighbouring townships in the same county, and one has more than twice the households of the other. A business that drew its circle around the village name instead of the township would be planning for a market that is not the one walking through its door.
So start with a list of where your last 50 customers live. Then choose the townships, cities or ZIP codes that cover most of them.
Step 2: Pull population, households and income
The source is the American Community Survey. According to the Census Bureau, it samples approximately 3.5 million housing unit addresses a year. It is a sample, so every figure has a margin of error, and for a small town that margin is wide. Treat the figures as good to the nearest few hundred, not to the last digit.
Search for your place on the Census Bureau's data site (data.census.gov) and open its profile. Use the 5-year estimates. The Census Bureau's guidance is that 1-year estimates are published only for areas with 65,000 people or more, and 5-year estimates cover all areas. Both townships above are well under that line, as are most places a Michigan business serves. What you get is a five-year average, not last year's count.
Write down three rows: population, households, median household income. For most local businesses, households is the row that counts. A household buys one roof, one furnace service, one lawn contract. This is the most useful census data for business planning there is, and it costs nothing.
Step 3: Narrow to the households that could plausibly buy
Not every household is a customer. The same profile breaks households down in ways that let you trim:
households by income band, if your price needs a certain budget
owners against renters, if you work on the building
age of the householder, if you sell to retirees or to young families
the decade the housing was built, if you replace things that wear out
Pick one filter, or two at most, that follow directly from what you sell. Every filter you stack multiplies the error in the one before it. Five filters deep, you are making numbers up with extra steps.
Step 4: Estimate your local market size with a purchase rate
Here is the sum. This is an illustration with made-up round numbers, not any real town or business.
Households in the area, from the Census profile: 10,000.
Could plausibly buy, assuming 60% own their home: 6,000.
Buy in a given year, assuming 1 household in 15: 400 sales.
Worth, assuming an average sale of $500: $200,000 a year.
The weak link is the purchase rate. Nobody publishes how often households in your township buy your service. Your own records are the best guide: if a typical customer comes back every seven years, about one in seven of the households who buy at all are in the market each year.
So run it twice. If the rate is 1 in 30 instead of 1 in 15, the same sum gives 200 sales and $100,000. The honest result is "somewhere between $100,000 and $200,000 a year," and the width of that range is itself useful. If your decision works at the low end, go ahead. If it only works at the high end, you have learned what you need to find out next.
Step 5: Sanity-check against who already shares it
That money is not all yours. It is split with everyone else who does what you do.
For a count of competitors, the Census Bureau's County Business Patterns gives the number of establishments by industry down to county and ZIP code level. It only counts establishments with paid employees, so it misses one-person operations. In Michigan that is most of them: the SBA Office of Advocacy's 2025 state profile counts 983,079 small businesses, of which 809,426 have no employees (2022 data). So also search a map for your service and count the pins.
Then divide. In the illustration, $200,000 across eight competitors is an average of $25,000 each. If your plan needs $150,000 from this area, you are not planning to join the market. You are planning to take three quarters of it. Better to know that before the lease is signed.
What the estimate is good for
An hour of this will not tell you what you will sell. It tells you whether the ceiling is high enough to be worth the climb, and which assumption deserves checking first.
If the low end of your range comfortably covers the decision, do not spend money on research. If the decision is large and the range straddles it, that is the case for paying someone to tighten the numbers.
The next step
Run the five steps for the one area you care most about and write the range down. If you want someone to argue with the assumptions, get in touch. The first review is free, and our monthly pricing is on the site for anything beyond it.
Comments
Be the first to comment.